
Core Web Vitals are a critical element of website optimization and performance, providing key insights into how users experience a website. They measure how quickly page loads and how long it takes for the user to interact with it.
When considering Core Web Vitals, it’s important to understand the difference between field and lab data. Field data is collected from real-world users in their natural browsing environment, while lab data is collected in a controlled environment. Each data type has its strengths and weaknesses and can be used to understand website performance better.
Table Of Contents
−
In this article, we’ll discuss the differences between field data and lab data and how they can be used to optimize your website for Core Web Vitals.
What are core web vitals?
Many tools are available to help you measure Core Web Vitals, which are now gaining importance for Google search rankings. This article discusses variations between these tools and how publishers can enhance their Core Web Vitals by utilizing lab and field data.
Google unveiled a brand-new collection of measures in May 2020 under “Core Web Vitals.” These were created to assist web designers in making their websites as user-friendly as possible.
The current collection of Core Web Vitals consists of three measures, each of which focuses on a different component of the user experience: Largest Contentful Paint (LCP), First Input Delay (FID), and Cumulative Layout Shift (CLS).
- The largest contentful paint (LCP) gauges the speed at which your website loads or how quickly it displays on the screen.
- Cumulative Layout Shift (CLS), which measures visual stability, effectively measures how unexpectedly your material moves.
- First Input Delay (FID) takes into account interaction, or how quickly a website responds to user input (e.g., by clicking on a link)
Field data
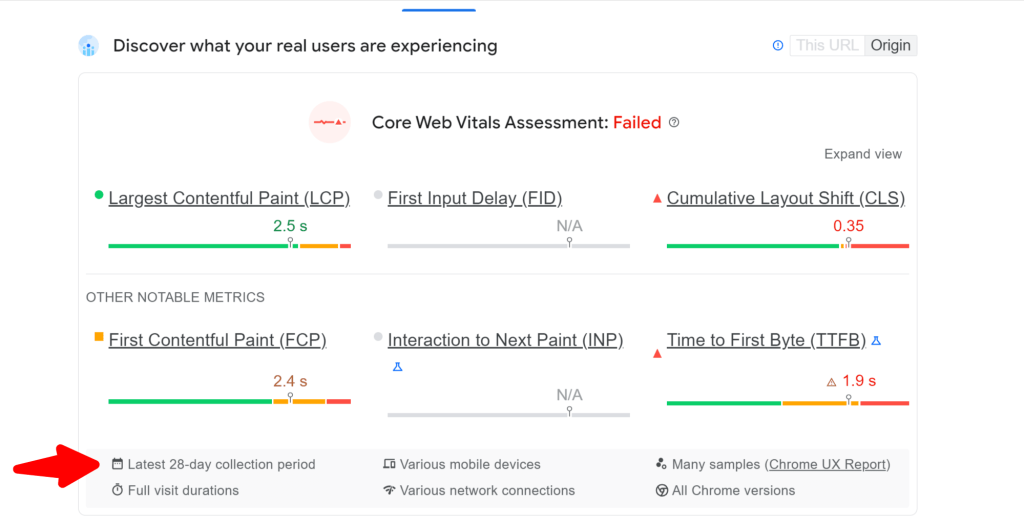
The field data is in the blue rectangle, and the lab data is in the green rectangle. The screenshot shows that while Field Data looks fantastic, Lab Data has some concerns with Cumulative Layout Shift and Largest Contentful Paint. Does this suggest that the page is broken? Depending on who you ask, you’re doing fantastic if Google and Page Experience are what you’re concerned about.
You can see from LCP that it is 87% “good,” 8% “needs work,” and 6% “bad.” 101% in total, Bezos receives more than he needs or deserves once more.
Here is the actual meaning of those numerals. This page has had the following changes over the last 28 days:
- LCP lower than 2.5 seconds in 87% of loads
- LCP between 2.5 and 4.0 seconds in 8% of loads
- LCP higher than 4.0 seconds in 6% of loads
On a variety of real-world hardware and network connections, the page loads. The information you see on these page loads is taken from the CrUX report. Real people who visit your URL provide anonymous stats for the CrUX (Chrome User Experience) report. Field data is what it is called because it is gathered outside. Even if a website were not added to Google Search Console, its information would be there in CrUX as long as it receives enough hits.
Field data is produced by regular Google Chrome users using:
- Various PCs and mobile devices (different resources like CPU, RAM, and GPU).
- Various internet speed ranges.
- Many sites.
- Only the URL that is tested in PageSpeed Insights generates field data.
- Field data is based on the Chrome User Experience Report (CrUX). Therefore, it isn’t real-time data; instead, it’s an average of the user data gathered over the last 28 days for the URL under test.
- If at least 75% of the page views to the tested page reach the “good” criteria, the page is rated as having “good” performance for that measure. Google calculates the score using the 75th percentile value of all page views to the tested page.
So it is common to see field data perform better than lab data if most of your consumers are from a population with fast internet and robust gadgets.
On the other side, it is typical to see lab data recording bigger numbers than field data if your server is overloaded when the test is being conducted.
Lab data
Checking your Lab Data scores will allow you to gauge the impact of your changes if you still wish to increase your Field Data values. Waiting 28 days to see if your Field Data figures increased or decreased doesn’t make any sense.
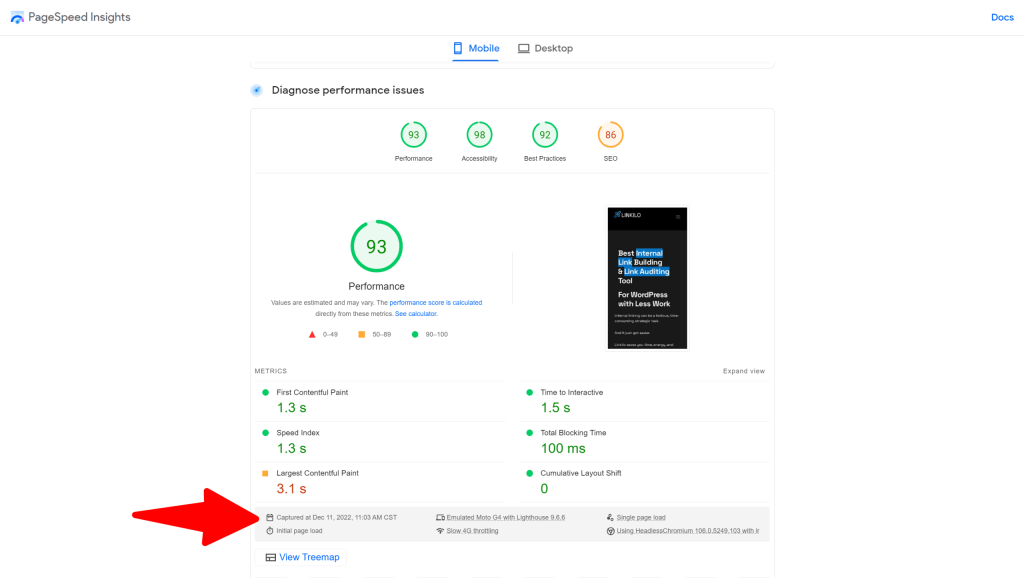
But what precisely does Lab Data stand for, and why does it perform so poorly on mobile? Field data is acquired in a different way than lab data, and lab data is recorded using Lighthouse (a tool for evaluating web pages) from a single page load that takes place under particular conditions:
- Latency: 150ms
- Throughput: 1.6Mbps down / 750 Kbps up
- 4x CPU slowdown
For this reason, even if your Field Data looks fantastic, you should continue to work on your Lab Data scores. Not everyone will experience the website as you do on your brand-new iPhone on a 1 Gb network. You may either make the website load quickly for everyone or accept that you’re leaving some folks behind.
What you should know about lab data:
- LightHouse technology, which simulates mobile throttling with a lesser speed, powers lab data. Read more here.
- Lighthouse often uses a slower CPU than other users’ CPUs because it “applies CPU throttling to imitate a mid-tier mobile device even when running on significantly more capable desktop hardware.”
- Lighthouse typically uses a single place (USA).
- Only the tested URL generates lab data in the Google PageSpeed Insights service.
- The pace at which the test was conducted is reflected in lab data, which is real-time data.
- Some user interface components, such as FID, won’t be accessible in the lab data.
Which tools can you use to measure Core Web Vitals?
Using a combination of lab and field data, you can use various tools from Google to assess your Core Web Vitals performance score. The table below compares these for you.
| Core Web Vitals measurements tools | Data type | Data frequency | Data Levels |
| PageSpeed Insights | Lab and field data | Shows 28-day average | Site Level and Page Level |
| Chrome UserExperience Report(CrUX) | Field data | Historical data is updated monthly | Site Level |
| Google search console | Field data | Shows 28-day average | Page Level |
| Chrome developer tools | Lab data | Only for the user currently browsing | Page Level |
| Lighthouse | Lab data | Only for the user currently browsing | Page Level |
| Web VitalsChrome Extension | Field data | Only for the user currently browsing | Page Level |
| Clickio WebVitals Monitoring | Field data | Real-time field Data | Site Level and Page Level |
| Clickio CheckCore Web Vitals | Field data | Based onCrUX report | Site Level |
Factors to consider when choosing a Core Web Vitals monitoring tool
The tools above can all be useful for calculating your Core Web Vitals, but there are a few things you might want to think about before selecting one.
Does it provide real-user data?
As has already been said, to see scores based on what your users are experiencing on your site under actual usage circumstances, real-user (field) data is required.
The data provided by Chrome User Experience Report offers a quick way to assess the performance of sites, but it does not provide the detailed, per-pageview telemetry that is often necessary to accurately diagnose, monitor, and quickly react to regressions. As a result, we strongly recommend that sites set up their own real-user monitoring.
According to Google
How recent is the data?
Knowing how recent the information in your Core Web Vitals report is can help you take the appropriate action. For illustration, the monthly updated historical data is used in the Chrome User Experience Report.
Therefore, seeing this in the report could take some time if your Core Web Vitals suddenly drop. You’ll need to wait a month to observe the effects of any changes you make to address any problems. Only real-time information enables you to take swift action to lessen the effects of any decline in your Core Web Vitals.
How much detail do you get?
Some solutions display your site’s overall score, making it impossible to compare the scores of various pages. Selecting a tool with page-level detail will enable you to improve any specific pages that negatively affect your score.
What to do when the results are different
You should use field data to prioritize your efforts if you have lab and field data for a given page. Field data is the most accurate way to truly grasp what your users are having trouble with and what needs to be improved because it represents what actual users are experiencing.
On the other side, it’s important to know what more optimizations can be performed if your field data indicate good scores across the board but your lab data indicate there is still space for improvement.
Additionally, field data only records actual user experiences for visitors that can properly load your website. Lab data can occasionally be used to find ways to broaden your site’s audience and make it more accessible to people using older or less powerful devices or slower networks.
Overall, accurate performance measurement depends on both lab and field data. They both have advantages and disadvantages, so if you’re only employing one, you might sacrifice a chance to give your users a better experience.

Jay
I've worked for WooRank, SEOptimer, and working on a cool SEO audit tool called SiteGuru.co. Now I have build Linkilo and SEO RANK SERP WordPress theme. I've been in the SEO industry for more than 5 years, learning from the ground up. I've worked on many startups, but also have my own affiliate sites.

TRY OUR FULLY SEO-OPTIMIZED WORDPRESS THEME FOR AFFILIATE MARKETERS!
No need to hire SEO experts anymore to fix your site technical SEO issues
IMPROVE YOUR SITES RANKING TODAY